Wednesday, May 16, 2007
Collaborative Cartography
Over this past semester, I have experienced the world of cartography (as you have read in all of my blogs). We not only employed the art of cartography to create maps of our own, but we reviewed how cartography is seen and affects people in the world as well. Throughout my blogs, I have talked about x-treme cartography, historical cartography, virtual cartography and many other aspects of cartography that many people don't realize. Cartography is employed everywhere to show many different things. When I started this semester, I had little idea about the importance of cartography let alone know how to use any software to create maps of my own. But I learned how. In the beginning we made maps using data from the census burea (great information and data source) and our project was to portray this data as a map on a poster. My poster was on ethnicity. Using data from the census bureau and software from mapviewer, I created my first map. This was a big step towards my future career. From this process, I not only learned how to find data and put it into a from that could be read by the software I was using, but learned about the software as well. From this, I found out that creativity plays a major role in designing maps and tis is what hooked me. Not only are you showing information to a viewer when designing a map, but you are showing them your creativity as well. You can make a million different maps that all show the exact same thing. The next project in the semester was understanding virtual worlds like Google Earth and how to use them to our benefit when making maps and posters. Google Earth is an amazing thing to have. It gives you a whole different perspective that you can't get looking at anything else. In this project, I decided that I was going to use Google Earth Pro and Nasa World Wind (another virtual world) to talk about cycling through the mother lode in California. Using this software was amazing. Not only could I show pictures that I took about the area I was describing, but I could also use aerial photos that showed this areas topography from space giving the viewer a cooler perspective to look at. With all this new technology that was being presented to me during this class, it gave me a brighter outlook about the future of cartograpy and helped to enhance my own creativity. The last project we set out to do in this class was designing pages that would go into an atlas of Nevada. This encorporated everything I had learned from throughout the semester. With an intended audience of younger kids, I had to decide what kind of information I wanted to show but still keep it fun and interesting at the same time. With the class coming to an end, I have to conclude that I have definitely learned a lot this semester. I have also learned that being a cartographer would actually make a great career. Cartography is used in everyday life and the demand for it only keeps growing and growing. With advances in technology happening all the time, there is no limits and how far cartography will go. Stay tuned and think spatial. Some day in the future, one of the maps you see maybe designed by the mapster.
Mapping Nevada

One of the most interesting things you can do is look at maps of the area that you live in. There is so much information you can learn that you never knew before. Living in Nevada, there is so much vast area where people don't live and unless you were to drive out there, maps would be your only key to learning about these areas. But what if you were the one making these maps. What kind of information would you want your readers to know? In class we are trying to put together an atlas of Nevada hence my topic today, mapping Nevada. We have been discussing for awhile know the topics we think are important and the viewers that we expect would be looking at these maps. So we chose 4th graders as our expected viewers. Making an atlas of Nevada for fourth graders, we don't want to get to detailed and we want to make the maps fun to look at so the fourth graders will not lose their interest. For me, one of the coolest topics and one of the map pages for the atlas that I suggested was on climate. I think this would be a good page because it is important to know why Nevada is the way it is and how the weather affects this. On my climate page, I would talk about how much annual precipitation the Nevada receives, rain and snow. I would also talk about the annual temperatures and give a brief description of what it's like to live in the state of Nevada through each season. I would also like to give a brief description of the rain shadow effect. I think it is important for younger kids to know why Nevada is a desert when nearby California is green and recieves a lot more rainfall. To make this page interesting, I would add fun facts like how many days of sun Nevada expects to see each year or another fun filled fact about weather. As far as the cartography side of this goes, I think it would be interesting to design maps showing the relationships between Nevada's annual precipitation and temperatures or things like that. Another cool image could be taken from Nasa's World Wind. This photograph from space could show what the clouds do as they approach Nevada and disappear during a storm. This would be excellent evidence combined with an actual picture showing the rain shadow effect. There are many different atlas pages we could come up with for Nevada. Nevada is an interesting place and mapping it is even more interesting. The map at the top right was taken from about.com and shows the geology of Nevada
Tuesday, May 15, 2007
Virtual Worlds
One of the most amazing things about technology in todays world is the fact that it is so advanced it is out of this world. With the art of cartography advancing just as fast as technology will allow it to, the world of maps is getting more and more amazing.
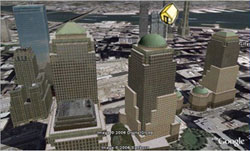
So what is a virtual world? A virtual world basically is an unreal world portrayed as if it were real. With the help of technology, virtual worlds are depicted as almost too real. Virtual worlds today include Google Earth, Nasa World Wind, and many other different softwares that portray the world as realistically as possible. Lets go further in depth into the virtual world of Google Earth Pro (the new edition). Google Earth Pro allows users to view a virtual earth as if it were realistic. You can zoom in on cities and see buildings in 3-dimensions. You can bascially look at any place on the planet in pretty good detail and get a good understanding of what's there, terrain and all. Google Earth even allows you to view the things you want to see. Just a click of the button can show you where national parks are or even where churches are. One of the cool things about the new Google Earth is the fact that you can place pictures of anything up for the world to see. This adds to the realism that Google Earth has to offer. Another one of the amazing things you can do is fly by's. These fly by's allow a user to mark a path any where within the virtual world and have the screen automatically jump there when you push play. This is cool if you want to show people a bike path you have been riding or the golf courses you've played. With all this new technology, there is some cons to using Google Earth Pro. While being a virtual world, it is not as realistic as you might want it to be. There are still many areas of the earth that are not as clear as others. Some of the terrain shown in 3-dimensional form is a bit rough as well. But who can complain. Software like this is very useful to many people professional or not. Software like this can enhance presentations greatly. You can not only show what an area looks like with a topo map or a picture, you can also add a view from space that shows fairly good detail and the physicla landscape. How can looking at urban growth of cities be any easier when you can actually see the buildings and residential areas. In conclusion, virtual worlds are amazing and can be greatly useful. The cons do not outway the pros and this software only gets better and better. The picture above is taken from the google earth website and shows the 3 dimensionality a virtual world can offer.
Subscribe to:
Comments (Atom)